For the first time in 338 years of recorded data, the gold-to-silver ratio has remained at extreme levels for over five consecutive years. According to Crescat Capital’s Tavi Costa, this persistent imbalance marks one of the most statistically significant dislocations in precious-metals history.
Today, with gold trading near US $3,954 per ounce and silver around US $47, the ratio sits close to 84:1 — meaning it takes 84 ounces of silver to buy one ounce of gold. Historically, that ratio has averaged about 30:1. If it were to revert merely to that long-term mean, silver would need to appreciate to roughly US $135 per ounce — a 180% gain from current levels, even if gold prices stay unchanged. Even a partial move toward 50:1 implies silver above US $82, comfortably eclipsing its 2011 highs.
This setup — a stretched ratio that has persisted for half a decade — is the kind of macro anomaly that long-term contrarians wait years to see.
What the Gold-to-Silver Ratio Tells Us
The gold-to-silver ratio measures relative valuation between the two metals. For centuries, it has oscillated around a historical mean of ~29:1, widening during deflationary crises (when gold’s safe-haven appeal dominates) and compressing during reflationary or commodity-driven expansions (when silver’s industrial utility shines).
Silver’s dual nature — part monetary metal, part industrial feedstock — makes it inherently more volatile than gold. When liquidity returns to markets and real assets attract capital, silver tends to outperform dramatically. That relationship has repeated across centuries — from the 1700s bimetallic era through the post-Bretton Woods commodity cycles.
A Historical Outlier
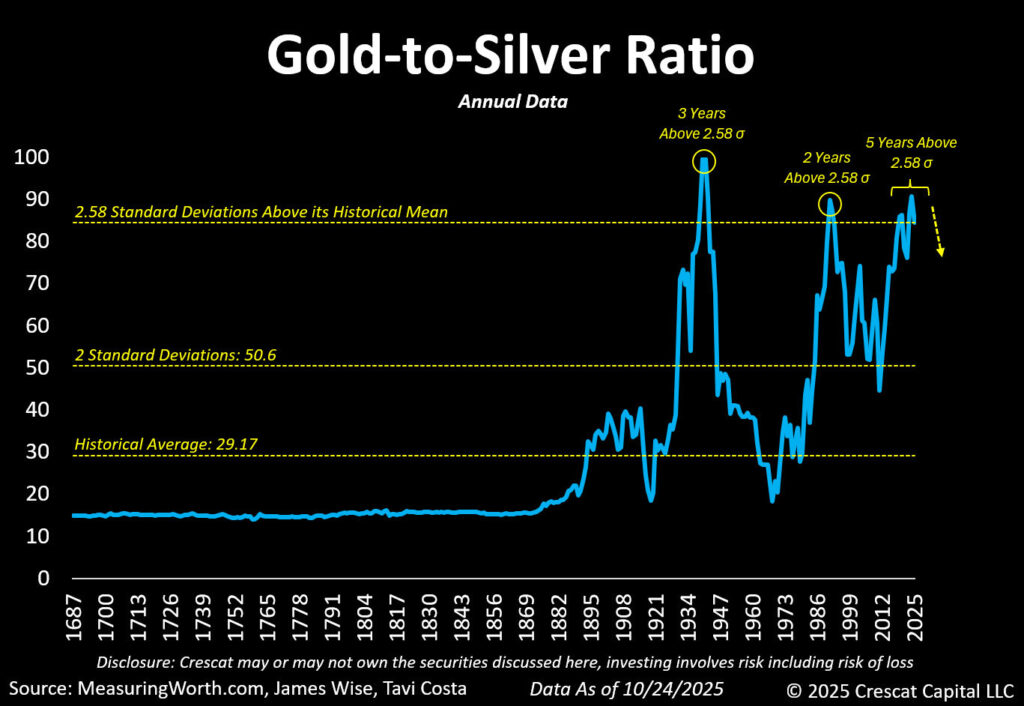
Costa’s research, using data from MeasuringWorth.com and Crescat Capital, highlights just how rare the current divergence is. For the first time since 1687, the ratio has remained more than 2.6 standard deviations above its long-term mean for five straight years.
The accompanying chart shows three major peaks in modern history:
1. The Great Depression (1930s) — followed by a decade in which silver doubled gold’s performance.
2. The late 1980s–early 1990s — preceding a multiyear silver bull market.
3. The post-2019 period — where the ratio has lingered at record levels, forming what Costa calls a “triple-top.”
His warning is simple: “Triple tops rarely hold.” When this ratio finally breaks down, the move tends to be swift and decisive — and silver usually leads the charge.
Why a Correction Looks Inevitable
From a statistical and cyclical perspective, today’s 85:1 ratio is unsustainable. A five-year stay above 2.6 sigma is akin to stretching an elastic band to its limit; the longer it’s held, the more violent the snap-back.
Several powerful forces may drive that reversion:
Monetary Reflation: Central banks remain trapped between inflation and debt service. Any policy easing or liquidity expansion typically reignites demand for tangible stores of value — silver’s smaller market cap means it can move far faster than gold.
Industrial Demand: Silver is indispensable in solar panels, semiconductors, and electric-vehicle manufacturing. The global push for renewable energy effectively guarantees rising structural demand.
Constrained Supply: Global silver mine output has stagnated for over a decade due to under-investment and declining ore grades. With gold supply holding steadier, the relative scarcity gap continues to widen.
Investor Positioning: Institutional portfolios remain heavily weighted toward gold, with silver allocations near multi-decade lows. Even a modest shift could create disproportionate upside given the market’s limited float.
Echoes of the Past
History shows that such extremes rarely persist. After the 1990 peak, silver rallied more than 80% within two years. Following the 2008 financial crisis, the ratio collapsed from 84:1 to 31:1 by 2011, while silver soared from US $9 to nearly US $50 — a fivefold gain.
If that pattern repeated today, with gold steady around US $4,100, a return to 31:1 would place silver at ~US $132 per ounce. That would not be unprecedented — it would simply restore the historical balance that defined most of the last three centuries.
Positioning for the Opportunity
For investors, the question isn’t whether gold remains valuable — it’s whether silver now offers greater asymmetry. Gold preserves purchasing power; silver amplifies it when sentiment turns.
Ways to participate include:
Physical silver — bars or coins for direct ownership without counterparty risk.
Exchange-traded funds (ETFs) like SLV (physical-backed) or SIL J (silver miners) for liquid exposure.
Mining equities, which historically deliver two-to-four times the metal’s price performance during bull markets.
Relative trades — long silver and short gold — for investors betting explicitly on ratio compression rather than absolute price direction.
Given silver’s higher volatility, disciplined sizing and long-term horizons are key. Yet for portfolios already diversified with gold, even a modest silver allocation could meaningfully boost performance if this historical reversion unfolds.
Why “This Time” Isn’t So Different
Some analysts claim the ratio should stay high because silver’s monetary role has faded or because gold enjoys stronger central-bank demand. But such arguments ignore the data: across 338 years, deviations of this magnitude have always normalized.
Markets, like nature, seek equilibrium. When an imbalance endures this long, it rarely corrects gradually — it snaps. The past five years above 2.6 σ mark an event horizon few investors appreciate until it’s behind them.
Final Thoughts
The gold-to-silver ratio’s 338-year history mirrors humanity’s relationship with money, technology, and trust. Each extreme has signaled transition — from deflation to inflation, from paper promises to tangible value.
Today’s 84:1 reading, with gold at US $3,954 and silver near US $47, represents one of those turning points. Should the ratio revert even halfway, silver could reach US $82 per ounce; a full reversion to 30:1 would imply US $135 silver.
In a world grappling with debt, inflation, and energy transition, that outcome is less a fantasy than a mean-reversion waiting to happen.